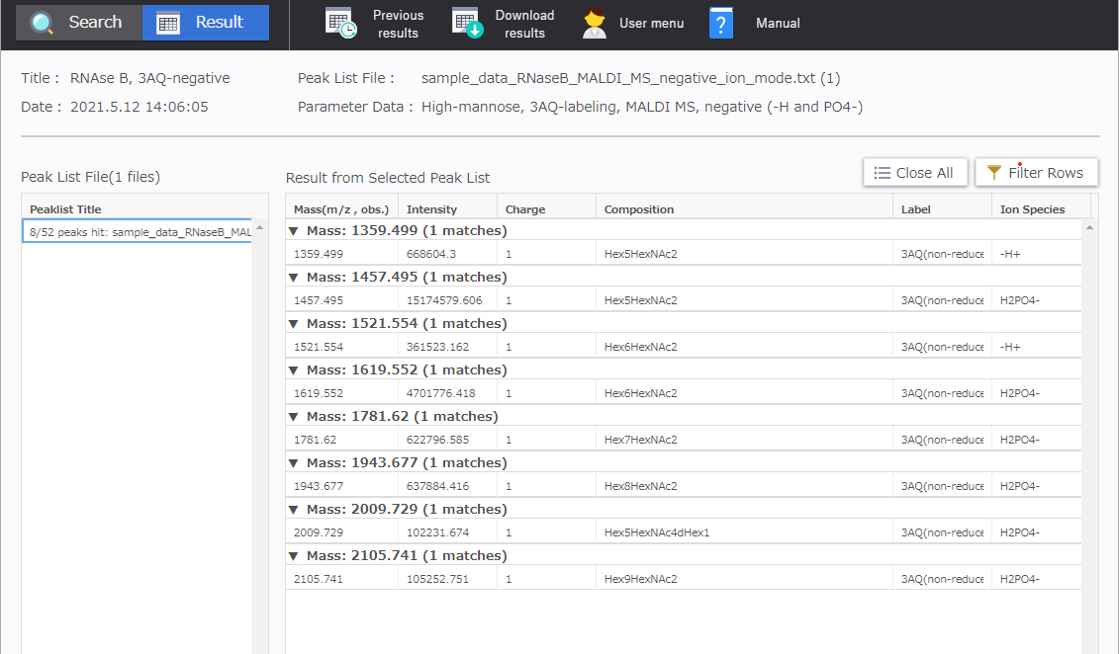
Viewing Analysis Results
The estimation results are displayed after peak matching is complete. The candidate compositions for each peak m/z are displayed in the [Result from Selected Peak List] area 1.
Note) In the current version, peaks are not displayed if they have no estimated candidate composition.
- 1
In the current version, peaks are not displayed if they have no estimated candidate composition.
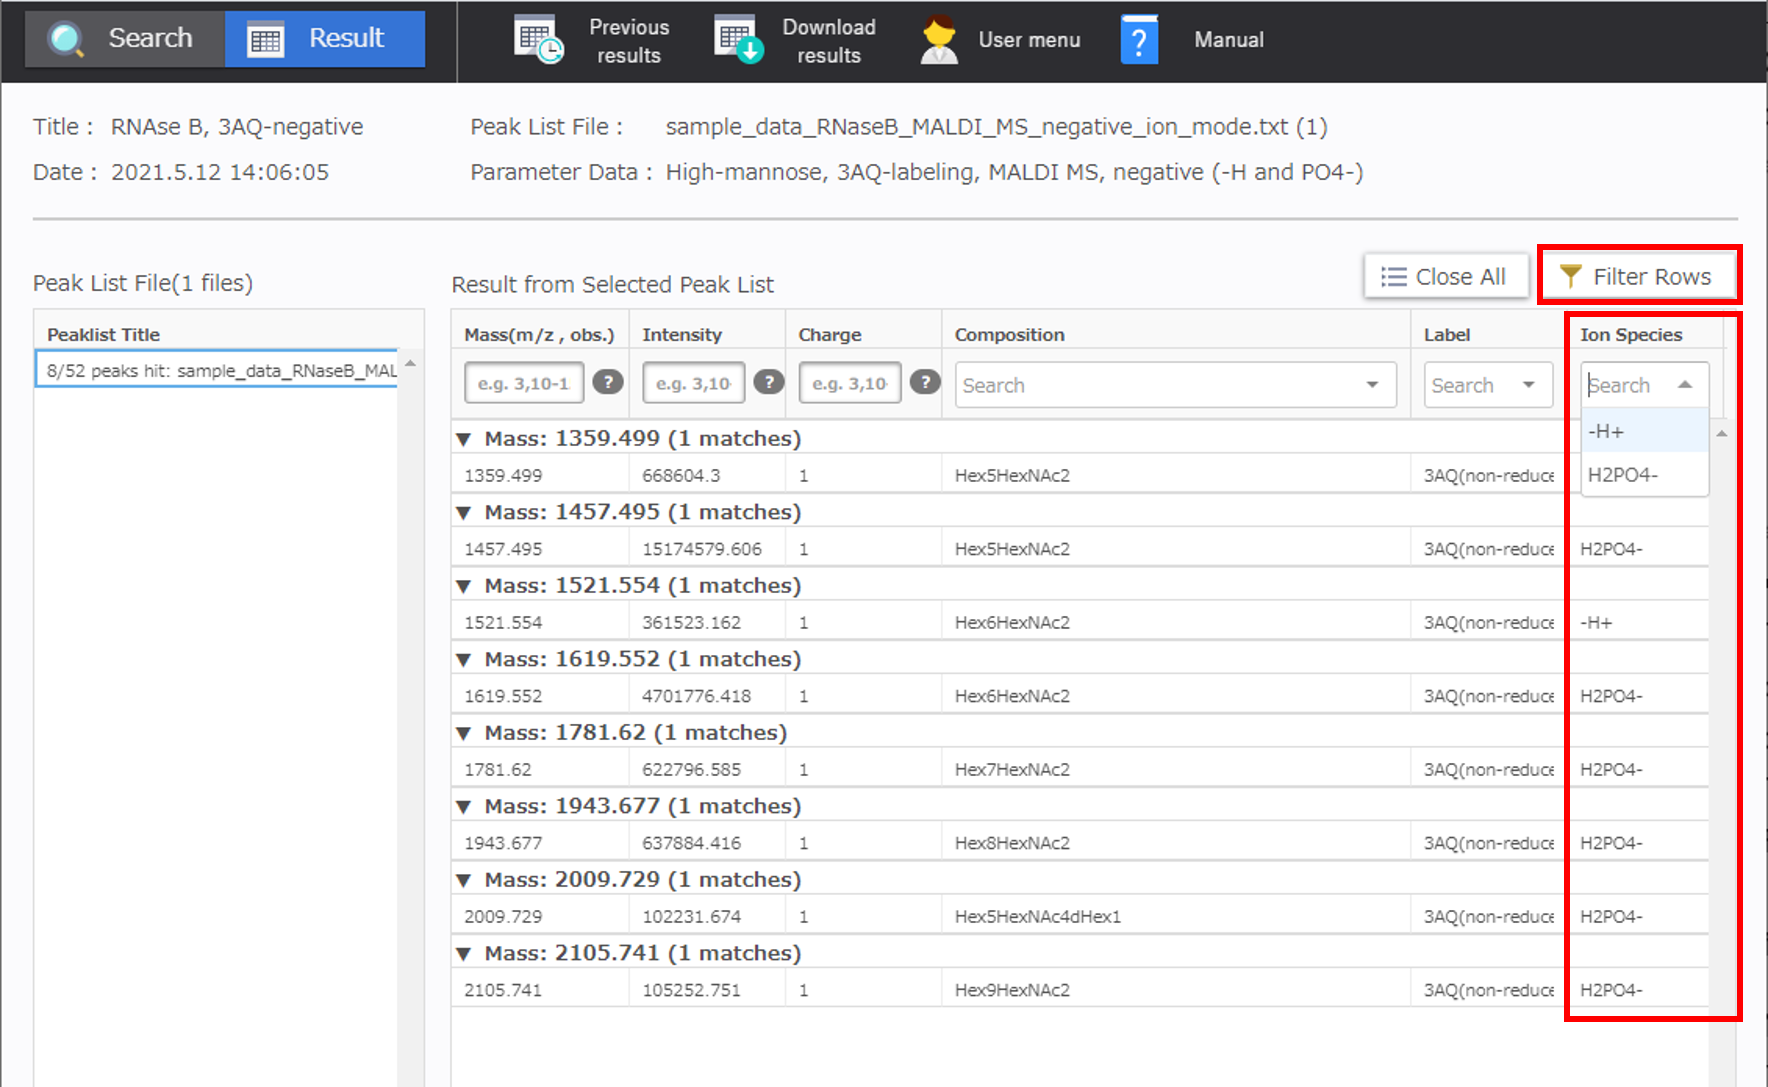
Filtering
Click [Filter Rows] to display a filter conditions entry form in the column header area of the composition candidate display grid. To display the filter results, enter or select the filter criteria.
[Siailc Filter](Just for a user option for sialic acid derivatization)
The Sialic Filter (**SI**ailc **A**cid **L**inkage **I**somer **C**luster Filter) is a function that narrows down the candidates based on the mass difference between α2,3- and α2,6-sialic acid generated by Linkage-specific sialic acid derivatization method. The composition candidates can be narrowed down by identifying only the results listed as “plausible” 2.
For example, when 2-step SALSA is selected, α2,3- and α2,6- sialic acid is detected with a 28 Da peak interval difference. Based on this 28 Da interval, implausible candidate glycan compositions are indicated from those with a number of hits.
- 2
“plausible” will be listed in the [Siailc Filter] column if a modification is not selected in the [Linkage-specific] area on the [Sialic Acid Modification] tab page, or the peak group either contains no sialic acid or has only α2,3- or α2,6- sialic acid.
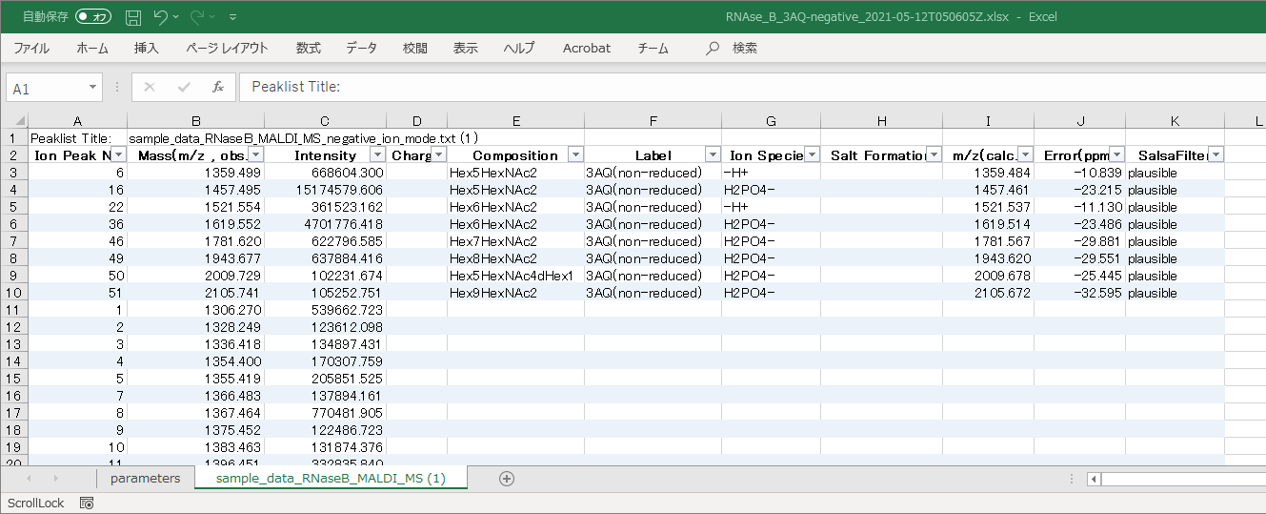
Exporting the Analysis Results
To download the results and parameters in Excel (“.xlsx”) format, click [Download results], at the navigation bar of the result window. Peaks with no estimated candidate composition (0 match) are also included.
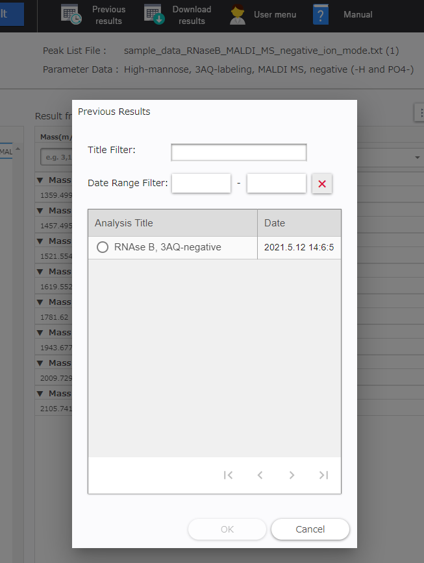
Browsing Past Analysis Results
Click [Previous results] and select a analysis title to display the results.