Deducing the Composition of N-Glycans Using MS ASSETsTM Glycan
In this tutorial, you will learn how to obtain the glycan composition from MS1 data for actual glycans, using MS ASSETsTM1 Glycan, glycan composition deduction software that uses a brute-force search algorithm.
Getting Started
Downloading the Tutorial Data
When starting the tutorial, first download the following tutorial data in zip format and unzip the data on the computer.
This tutorial uses the following two data files obtained by unzipping the zip file.
- peaklist-MALDI_MS_negative_3AQCHCA_RNaseB-0001.txt: This is a mono isotopic peak list file obtained from the MS data for glycans and is used as the input data for MS ASSETs Glycan.
- Result_peaklist-MALDI_MS_negative_3AQCHCA_RNaseB-0001.xlsx: This includes the results of an analysis of the above-mentioned peak list using MS ASSETs Glycan in accordance with this tutorial. It also includes the parameters used for the analysis. Use this file as a reference if the results you obtain are not as per this tutorial.
Signing in to MS ASSETs Glycan
Next, using a web browser, sign in to MS ASSETs Glycan, to display the analysis window.
Use one of the following three web browsers. (Note that Microsoft Internet Explorer is not compatible.)
- Firefox
- Chrome
- Edge
Two sign in methods are available. One sign in uses the password registered for a registered user. The other is a guest sign in. With the guest sign in, user authentication is not required, so MS ASSETs Glycan can be used immediately, but the analysis results and parameter settings details cannot be referred to later. For details, refer to “User Authentication” in the online manual.
Content of the Tutorial Data
The tutorial data was created based on MALDI MS data for N-glycans cleaved from bovine pancreatic ribonuclease (RNase) B using the endoglycosidase PNGase F.。
RNase B is known to receive N-linked glycosylation at the 34th asparagine position ([1]). The structures of these modified glycans are not homogeneous, but they have in common a core structure composed of two HexNAcs (GlcNAcs) and three Hexoses (Mannoses).
Even after being cleaved from the protein via PNGase F, the N-glycans retain the original glycan composition including the core structure, so the N-glycans subject to analysis in this tutorial have at least two HexNAcs and three Hexoses.
The following pretreatment was performed prior to N-glycan MALDI MS analysis. Regardless of the pretreatment, the objective is to perform a highly sensitive, comprehensive, and quantitative N-glycan profiling analysis([2][3])2.
- On the MALDI target, the glycan reducing terminal was labeled with 3-Aminoquinoline (3AQ).
- In order to measure structurally stable phosphate adducts of glycans, ammonium phosphate was added to the glycan sample.
The pretreated glycan sample was analyzed in negative ion mode using the MALDI MS method. A MALDI IT-TOF MS was used as the MALDI MS system.
The peak list, which summarizes the list of mono isotopic ion peaks detected in the MS data obtained, is provided as a mono isotopic peak list file together with the tutorial data. The freeware Mass++([4]) MWD plugin was used to detect the mass of the mono isotopic ions.
Workflow of Glycan Analysis Using MS ASSETs Glycan
With MS ASSETs Glycan, 1. Upload the peak list file into the analysis window; 2. Set the analysis parameters in the analysis window; and 3. Run the data analysis. 4. The analysis results are displayed in the analysis results viewer.
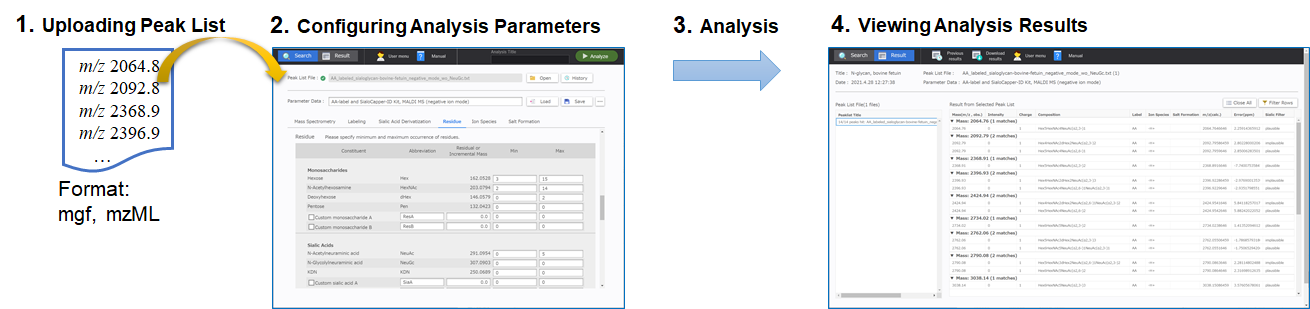
Uploading the Mono Isotopic Peak List File
Drag and drop “peaklist-MALDI_MS_negative_3AQCHCA_RNaseB-0001.txt”, the peak list provided with the tutorial data, into the [Peak List File] text form in the analysis window in MS ASSETs Glycan. You can also specify the file to upload by clicking [Open].
Setting the Analysis Parameters
Set the analysis parameters as follows.
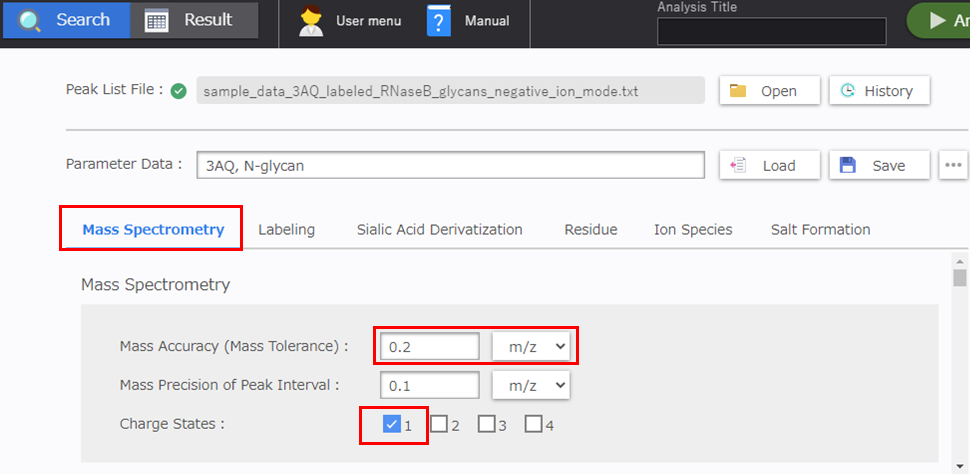
[Mass Spectrometry] Configuration
Specify the allowable mass error in accordance with the instrument. The allowable mass error is prescribed based on the mass accuracy estimated from the measurement data for the standard sample. Normally, the [1] checkbox is selected in the [Charge States] area for MALDI MS analysis.
- Mass Accuracy (Mass Tolerance): 0.2 m/z
- Charge Status: 1
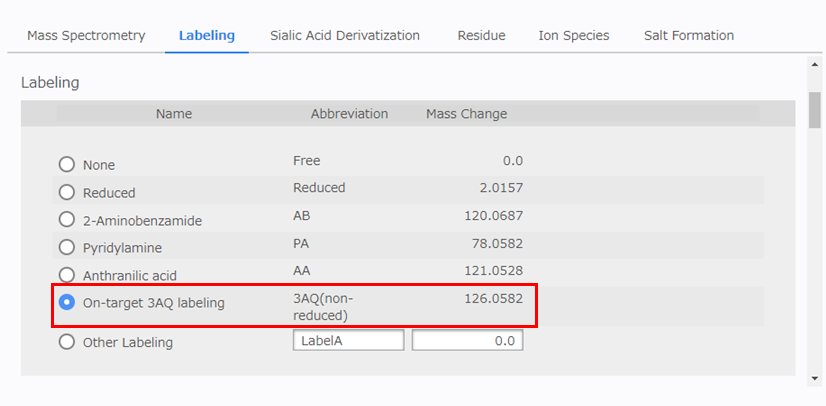
[Labeling] Configuration
Select [On-target 3AQ labeling] as shown below.
- On-target 3AQ labeling 3AQ(non-reduced) 126.0582 (Da)
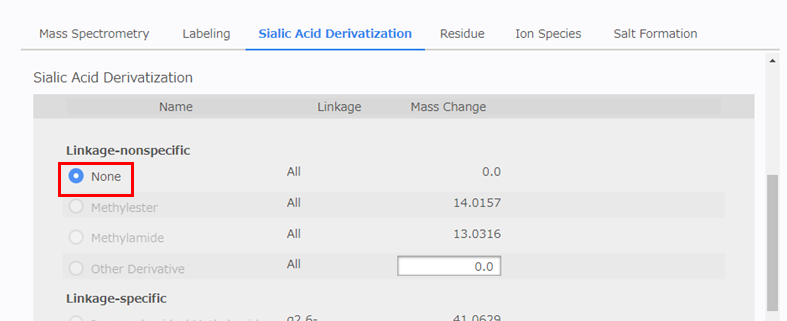
[Sialic Acid Derivatization] Configuration
Sialic acid derivatization is not implemented, so select [None].
- None
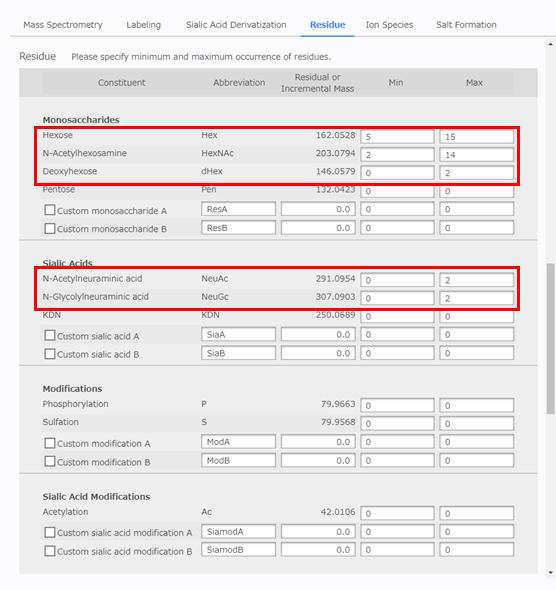
[Residue] Configuration
Specify the glycan composition range subject to search. To ensure that the N-glycans are subject to search, they must be composed of a minimum of three Hexoses, two in the case of HexNAc. In addition, mammals other than humans produce two types of sialic acid, N-acetylneuraminic acid and N-glycolylneuraminic acid, so specify up to two respectively3.
- Hexose: 3-10
- HexNAc: 2-10
- Deoxyhexose: 0-2
- N-Acetylneuramininc acid: 0-2
- N-Glycolyneuramininc acid: 0-2
- Others: 0-0
If you are analyzing glycans that include sugar residues not already listed on the form, enter the abbreviation for the sugar residue, the residual or incremental mass, and the composition range in the custom residue settings boxes on the form.
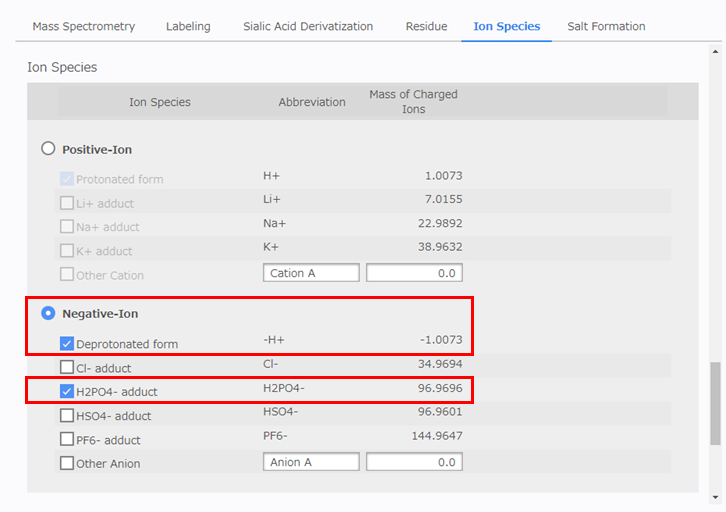
[Ion Species] Configuration
Select [Negative-Ion]. Next, for [Ion Species], select the [Phosphate adduct] and [Deprotonated form] checkboxes.
- Negative-Ion
- Deprotonated form
- H2PO4- adduct
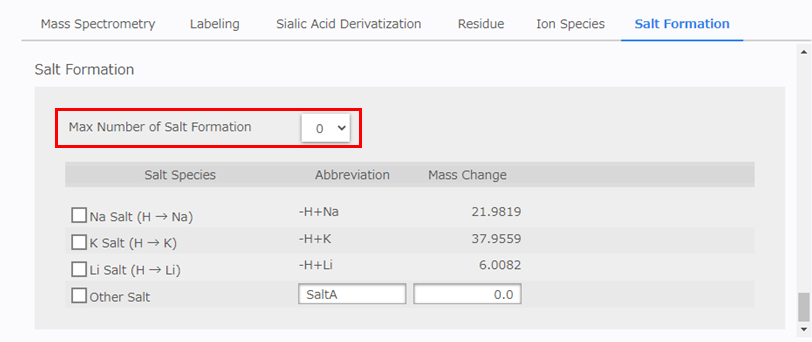
[Salt Formation] Configuration
Select [0] in the [Max Number of Salt Formation] box. If this value is set to [1] or more, there is a risk that the number of composition candidates will increase considerably. After performing the analysis, if composition candidates are not obtained for some peaks and the results suggest the formation of a salt noted in the [Salt Species] box for the glycan (salt substitution), select this salt and then repeat the analysis while slowly increasing the value in the [Max Number of Salt Formation] box until a candidate is obtained.
- Max Number of Salt Formation: 0
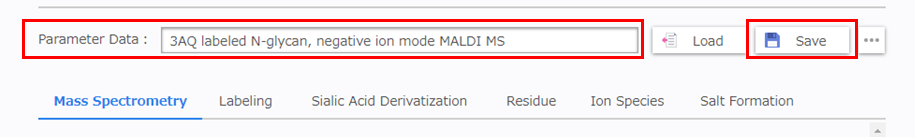
Saving the Analysis Parameters
After all the parameters have been set, enter the name of the analysis parameters in the [Parameter Data] box and click [Save]. An example is “3AQ labeled N-glycan, negative ion mode MALDI MS.”
Performing the Analysis
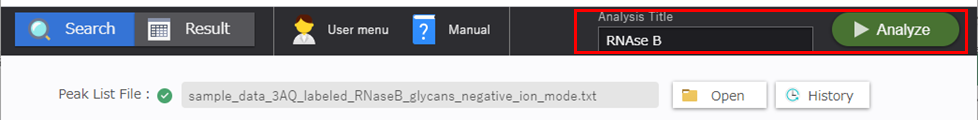
Enter an analysis title on the navigation bar and then click [Analyze].
When the progress bar is complete, the results display window is displayed.
Results
Displaying the Analysis Results
“8/52 peaks hit:” is displayed in the [Peaklist Title] in the [Peak List File] table in the results display window. This indicates that glycan composition candidates were obtained for 8 of the 52 ion peaks.
Next, the search results for the peak list selected in the [Peak List File] table are displayed in the [Result from Selected Peak List] table.
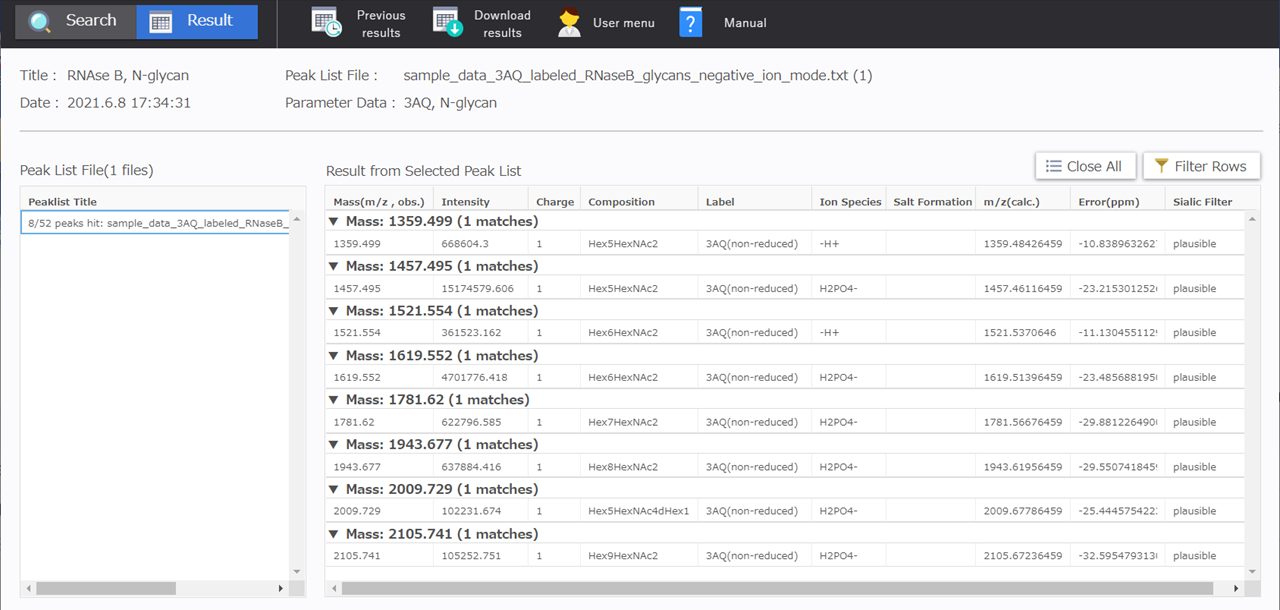
The m/z, peak intensity, and charge number are displayed in the [Mass (m/z, obs.)] column, [Intensity] column, and [Charge] column respectively for the peaks detected in the peak list. Next, glycan composition, ion type, and salt formation are displayed as glycan composition candidates in the table between the [Composition] column and the [Salt Formation] column. The candidate composition’s theoretical m/z, as well as the offset in ppm between the theoretical m/z and the m/z for the peak detected are displayed in the [m/z (calc.)] column and [Error (ppm)] column respectively. The [Sialic Filter] column at the far right of the table is a filter function for analyzing sialic acid linkage specific derivatization. The details will be explained in a separate tutorial.
From the RNase B N-glycans peak list, as shown below, one glycan composition candidate has been shown for each of the 8 respective ion peaks detected in the mass range from m/z 1359.4 to m/z 2105.7.
| Mass(m/z , obs.) | Intensity | Charge | Composition | Label | Ion Species | Salt Formation | m/z(calc.) | Error(ppm) |
|---|---|---|---|---|---|---|---|---|
| 1359.5 | 668604.3 | Hex5HexNAc2 | 3AQ(non-reduced) | -H+ | 1359.484 | -10.839 | ||
| 1457.5 | 15174579.6 | Hex5HexNAc2 | 3AQ(non-reduced) | H2PO4- | 1457.461 | -23.215 | ||
| 1521.6 | 361523.2 | Hex6HexNAc2 | 3AQ(non-reduced) | -H+ | 1521.537 | -11.130 | ||
| 1619.6 | 4701776.4 | Hex6HexNAc2 | 3AQ(non-reduced) | H2PO4- | 1619.514 | -23.486 | ||
| 1781.6 | 622796.6 | Hex7HexNAc2 | 3AQ(non-reduced) | H2PO4- | 1781.567 | -29.881 | ||
| 1943.7 | 637884.4 | Hex8HexNAc2 | 3AQ(non-reduced) | H2PO4- | 1943.620 | -29.551 | ||
| 2009.7 | 102231.7 | Hex5HexNAc4dHex1 | 3AQ(non-reduced) | H2PO4- | 2009.678 | -25.445 | ||
| 2105.7 | 105252.8 | Hex9HexNAc2 | 3AQ(non-reduced) | H2PO4- | 2105.672 | -32.595 |
Seven of these glycan compositions are Hex{5-9}HexNAc2, meaning that these glycans consist of five to nine Hexoses and two HexNAcs. Glycans with these compositions are likely high-mannose N-glycans.
The remaining composition candidate is Hex5HexNAc4dHex1, which was likely a complex-type glycan or a hybrid-type glycan.
Downloading the Analysis Results
The results obtained and the analysis parameters used can be downloaded as an Excel file in xlsx format. Click [Download results]. The parameters are noted on the “parameters” sheet. The sheets named with the other peak list names contain the search results for the applicable peak list.

Discussion
The figure below shows the ion peaks obtained from the MS data for the RNase B glycan sample (m/z, intensity) and their composition deduction results. (This figure is not displayed by MS ASSETs Glycan.)
Using the analysis parameters determined based on the characteristics of the glycan sample as well as the pretreatment method and measurement method, one glycan composition candidate respectively was obtained for the main peaks contained in the RNase B MS data.
Of the main peaks without candidates, the particularly intense peaks at m/z 1439 and 1602 are ions with high 18 Da mass candidates, clearly indicating that these are dehydration ions. Many of the remaining trace peaks are likely A ions generated by deprotonation of unstable neutral glycans.
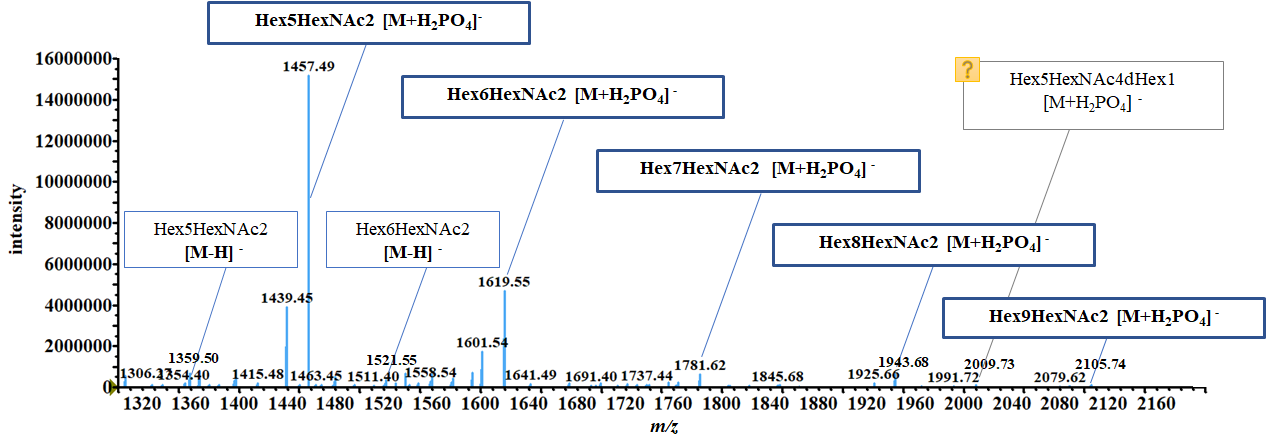
In addition, high-mannose glycans were mainly obtained as candidates from the mass data for RNase B glycans. As noted on the GlyConnect website shown below4, these results are consistent with previous documented reports.
- https://glyconnect.expasy.org/browser/proteins/529/sites?location=60&n=16
In addition to the high-mannose glycans, one complex-type or hybrid-type N-glycan was obtained as a composition candidate. However, other identical candidates were not obtained and there were also no reports of the applicable composition in GlyConnect. The possibility that these results are an artifact or due to contamination of the RNase B sample with another sugar protein cannot be dismissed.
Notes
In this tutorial, a unique glycan composition was obtained for the ion peaks, but if too few or too many glycan candidates are obtained, revise the analysis parameters.
In addition, it is necessary to run additional tests such as MS/MS to determine the glycan structure, regardless of whether or not the glycan composition candidates are narrowed down to one for each peak.
Conclusion
In this tutorial, as indicated below, glycan composition candidates were obtained from an analysis of MS data for RNase B glycans using MS ASSETs Glycan.
- In order to obtain the glycan composition candidates from the glycan MS data, the analysis parameters were determined based on the characteristics of the glycan sample and the pretreatment methods.
- Glycan composition candidates were then obtained for the main peaks in the MS data.
- The main composition candidates were high-mannose N-glycans, which agreed with previously documented reports.
- Limits to the analysis method
- In determining the glycan structure, additional tests such as /MS/MS are required.
References
[1]: G. Gotte, et al, J. Biol. Chem., 2003, 278(47), p46241-46251, DOI:10.1074/jbc.M308470200
[2]: K. Kaneshiro, et al, Anal. Chem., 2011, 83(10), p3663-3667, DOI: 10.1021/ac103203v
[3]: K. Kaneshiro, et al, Anal. Chem., 2012, 84(16), p7146-7151, DOI: 10.1021/ac301484f
[4]: S. Tanaka, et al, J. Proteome. Res., 2014, 13(8):p3846-3853, DOI: 10.1021/pr500155z
[5]: T. Nishikaze, et al, Anal. Chem., 2012, 84(21), p9453-9461, DOI: 10.1021/ac302286e
MS ASSETs is a trademark of Shimadzu Corporation and its affiliated companies in Japan. The TM symbol is omitted in this manual.↩
These pretreatments are also effective for highly sensitive analysis of glycan branch structures([5]).↩
RNase B glycans are high-mannose N-glycans and sialic acid content has not been reported. If after a number of analyses it is clear in advance that there is no sialic acid content, excluding sialic acid from the search is a good way of reducing the number of candidates.↩
With GlyConnect, the full sequence length of the protein precursor is adopted as the protein sequence, so the signal sequence length of the glycosylation site will be larger than the sequence number noted in this tutorial.↩